
By Jimmy Chebat, CEO & Founder of ZIZO
Call center performance metrics translate operational activity into business outcomes. However, most call centers track too many of them — or watch the wrong ones entirely. As a result, dashboards fill up with data that nobody acts on.
This guide organizes the metrics that actually matter into five categories: efficiency, quality, agent performance, customer experience, and workforce health. For each one, you’ll find the definition, the formula, the typical benchmark, and a note on when it helps versus when it misleads.
If you’re newer to operations, treat this as a reference. If you’ve run a floor for years, use it to audit which numbers you track out of habit instead of intent.
How many metrics should you actually track?
The honest answer: fewer than you think.
In practice, most high-performing call centers track 5–7 primary metrics at the agent level. At the team or floor level, the number rises to 10–15. Tracking more dilutes focus. As a result, agents start gaming whichever metric their bonus is tied to, and supervisors lose the ability to coach because they’re drowning in data.
As a general rule, every metric you track should have an owner, a target, and a coaching intervention attached to it. If a number appears on a report but nobody knows what to do when it moves, stop tracking it.
1. Efficiency metrics
First, these measure how productively your operation handles volume. Finance leaders care about them most. However, tracked alone, they push agents toward speed at the expense of quality.
Average Handle Time (AHT)
What it measures: The total time an agent spends on a single interaction, including talk time, hold time, and after-call work. Formula: (Total Talk Time + Total Hold Time + Total After-Call Work) ÷ Total Calls Handled Typical benchmark: 4–6 minutes for inbound customer service; varies widely by industry. Watch out: AHT is the most-gamed metric on any floor. Under AHT pressure, agents rush calls, skip QA steps, or transfer customers unnecessarily. For that reason, always track AHT alongside CSAT and First Call Resolution — never alone.
Average Speed of Answer (ASA)
What it measures: The average time a customer waits in queue before reaching an agent. Formula: Total Wait Time ÷ Number of Calls Answered Typical benchmark: Under 30 seconds is strong; under 20 seconds is excellent. Watch out: ASA is a workforce management metric, not an agent performance metric. Long ASA usually points to staffing or forecasting issues, not agent behavior.
Service Level
What it measures: The percentage of calls answered within a target time threshold. Formula: (Calls Answered Within Threshold ÷ Total Calls) × 100 Typical benchmark: The “80/20” rule — 80% of calls answered within 20 seconds — is the historical standard. Watch out: Service level is meaningless without a defined threshold. “We hit service level” without specifying the threshold is operations theater.
Occupancy Rate
What it measures: The percentage of an agent’s logged-in time spent actively handling interactions. Formula: (Talk Time + Hold Time + ACW) ÷ Total Logged-In Time × 100 Typical benchmark: 70–85%. Above 90% predicts burnout and attrition. Below 60% indicates over-staffing. Watch out: Pushing occupancy too high is the most common cause of attrition spikes. As a result, you should treat it as a health metric, not a productivity target.
Calls per Hour
What it measures: Volume handled per agent per hour. Formula: Total Calls Handled ÷ Total Productive Hours Watch out: This number helps with forecasting and capacity planning. However, it becomes dangerous as an agent KPI in customer-experience-driven environments because it incentivizes the wrong behavior.
2. Quality metrics
Next, these measure whether your team does the work well — not just quickly. Quality numbers act as the counterweight to efficiency numbers.
Quality Assurance (QA) Score
What it measures: A composite score derived from evaluator review of recorded calls, scored against a quality rubric. Typical benchmark: 85%+ is the common floor; world-class operations often hold 90%+. Watch out: Importantly, a QA score is only as good as the rubric. For that reason, you should audit your QA form annually. Most have at least one criterion that no longer reflects what good service looks like.
First Call Resolution (FCR)
What it measures: The percentage of calls resolved on the first contact, with no callback within a defined window (typically 7 days). Formula: (Calls Resolved on First Contact ÷ Total Calls) × 100 Typical benchmark: 70–80% for customer service; lower for complex technical support. Watch out: FCR is one of the highest-leverage numbers on this list. In fact, it correlates strongly with both CSAT and cost per contact. As a result, it deserves real investment.
Compliance Adherence Rate
What it measures: The percentage of calls that meet regulatory or policy compliance requirements. Watch out: In regulated industries, this should be a binary metric — agents either hit 100% or they get retraining. Coaching can’t compensate for compliance gaps.
3. Agent performance indicators
In contrast, these focus on individual contribution. They show up on the agent’s dashboard and drive coaching conversations.
Schedule Adherence
What it measures: The percentage of time an agent spends in the right state at the right time, per their schedule. Formula: (Time in Adherence ÷ Total Scheduled Time) × 100 Typical benchmark: 90%+ is healthy; below 85% indicates supervisor oversight gaps.
Conversion Rate (for sales or outbound)
What it measures: The percentage of contacts that result in a desired action. Formula: (Conversions ÷ Total Contacts) × 100
Attendance Rate
What it measures: The percentage of scheduled shifts an agent actually works. Watch out: In fact, a drop in attendance is one of the strongest leading indicators of agent resignation. The shift often shows up 30–60 days before the resignation itself.
Coaching Engagement
What it measures: Frequency and outcomes of coaching sessions per agent. Watch out: Most operations leaders overlook this one. However, tracking coaching as a KPI shifts supervisor behavior — what gets measured gets done. As a result, this becomes one of the most underrated levers for reducing call center attrition.
4. Customer experience indicators
Additionally, these measure how customers feel about the interaction. They serve as the most leading-indicator numbers you have for revenue retention.
Customer Satisfaction (CSAT)
What it measures: Customer-reported satisfaction with a specific interaction, usually via post-call survey. Typical benchmark: 80%+ is solid; 90%+ indicates a strongly performing operation.
Net Promoter Score (NPS)
What it measures: Customer likelihood to recommend, on a 0–10 scale. Formula: % Promoters (9–10) − % Detractors (0–6)
Customer Effort Score (CES)
What it measures: How much effort the customer felt was required to resolve their issue. Watch out: CES correlates more strongly with churn than CSAT does in most B2B and service-recovery contexts. For that reason, if you only track one customer experience number, this is often the best one.
5. Workforce health indicators
Finally, these measure the sustainability of your operation. HR teams often own these numbers. However, operations leaders who ignore them pay the price in efficiency and quality six months later.
Attrition Rate
What it measures: The percentage of agents who leave the organization in a given period. Formula: (Agents Who Left ÷ Average Headcount) × 100 Typical benchmark: Industry averages run 30–45% annually. Watch out: Importantly, you should track 90-day, 180-day, and 365-day attrition separately. They reflect different problems with different solutions.
Time to Proficiency
What it measures: Days from new hire start date to full productivity. Typical benchmark: 60–90 days for most call center roles.
Employee Engagement Score
What it measures: Pulse survey results capturing how engaged agents feel. Watch out: Annual surveys are too slow. Instead, move to monthly or quarterly pulses with 3–5 questions.
Internal Promotion Rate
What it measures: The percentage of supervisor and team lead roles filled by internal agents versus external hires. Watch out: When this drops below 50%, you have a career path problem.
How to choose the right call center performance metrics for your operation
You don’t need every number on this list. Instead, you need the right 5–7 for what you’re optimizing.
A simple framework:
- Pick one efficiency metric (usually AHT or Service Level)
- Pick one quality metric (usually QA Score or FCR)
- Pick one customer experience metric (CSAT, NPS, or CES)
- Pick one agent performance metric (Schedule Adherence or Conversion Rate)
- Pick one workforce health metric (Attrition Rate or Engagement Score)
Together, these five give you a balanced view: how efficiently you’re operating, how well you’re operating, how customers feel about it, how individuals are contributing, and whether the operation is sustainable.
That said, if you can only act on data for one category, start with quality. Quality numbers predict customer experience numbers, which predict revenue. In contrast, efficiency numbers without quality counterweights destroy long-term value.
Why dashboards alone don’t drive results
On the surface, tracking these numbers is the easy part. Moving them is harder. In fact, it’s not a measurement problem at all — it’s a behavior problem.
The gap between seeing a metric and changing it gets closed by three things:
- Real-time visibility — agents who only see their numbers in weekly emails can’t course-correct mid-shift
- Coaching cadence — numbers that aren’t discussed in 1:1s within 48 hours of moving don’t change
- Recognition and feedback loops — agents repeat behaviors that get reinforced, and stop behaviors that don’t
As a result, modern call center performance management software increasingly bundles tracking with coaching workflows, gamification, and recognition systems. The metrics handle diagnosis. The behavior tools handle treatment.
Frequently asked questions
What are the most important numbers for a call center to track? The most commonly tracked primary metrics are Average Handle Time (AHT), First Call Resolution (FCR), Customer Satisfaction (CSAT), Service Level, and Attrition Rate. However, the right set depends on whether the operation is inbound service, outbound sales, technical support, or collections.
What’s the difference between KPIs and metrics? All KPIs are metrics, but not all metrics are KPIs. A metric is any quantitative measurement. In contrast, a KPI is a metric tied to a specific business outcome and used to drive decisions. For example, AHT becomes a KPI when it has a target, an owner, and a defined response when it moves.
How often should call center performance metrics be reviewed? Agents need real-time visibility into their numbers. Supervisors should review them in 1:1 coaching sessions weekly. Additionally, team and floor-level numbers benefit from daily supervisor review and weekly leadership review. Strategic numbers like attrition and engagement deserve a monthly leadership review.
Which number predicts attrition the earliest? Attendance and schedule adherence typically serve as the earliest leading indicators. Both tend to deteriorate 30–60 days before a resignation.
Are these numbers different for outbound versus inbound operations? Yes. Inbound operations emphasize Service Level, ASA, FCR, and CSAT. In contrast, outbound operations emphasize Conversion Rate, Contact Rate, Calls per Hour, and Compliance Adherence.
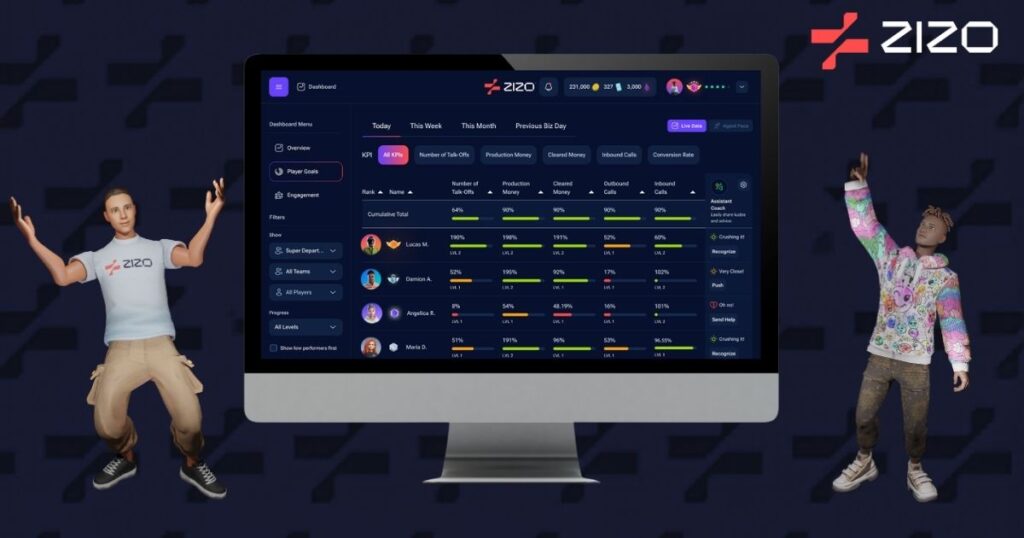
Want to track these numbers without building a dashboard from scratch?
ZIZO is built for operations teams that need real-time visibility, agent-level KPI tracking, and the coaching and recognition tools that turn measurement into behavior change. See it in action at playzizo.com.